Explanation of Results
The results of the RRSP Contribution Optimizer are broken down into a "Recommendation" section and "Details" section. If you are just looking for guidance on how much money to contribution to your RRSP, the recommendation section is all you need to review. If you want to understand some of the reasons behind the recommendation, you can review the details section.
The "Details" section is comprised of a chart and a table. An example chart is below:
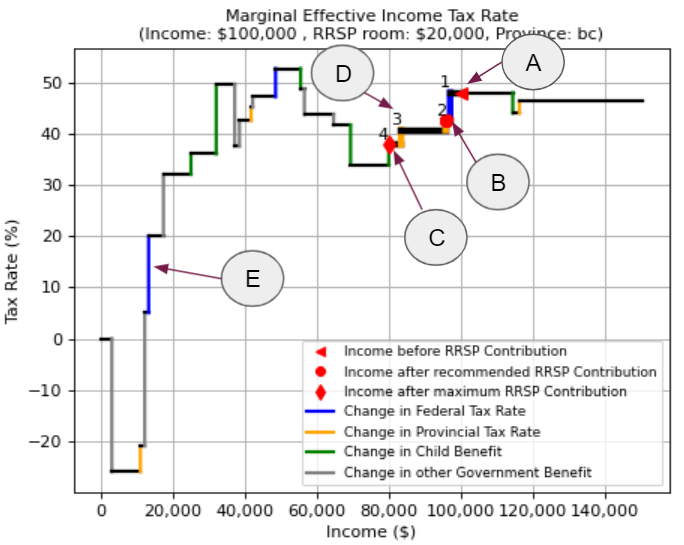 |
A: This is the income you entered into the tool, and shows the marginal tax rate you are paying before any RRSP contributions. B: This is your net income after making the recommended RRSP contribution. Your marginal tax rate at this point will generally be similar to your marginal tax rate from "A", since if it drops too much lower than "A", it isn't an optimal use of your RRSP room. See more explanation and examples. C: This would be your net income if you made the maximum possible RRSP contribution. In some case, this will be the same as "B", as the optimal case may be to use your full contribution room. In other cases, the net income will be lower than "B" because your marginal tax rate will have dropped significantly and it is not optimal to make the full contribution. D: This is the step number. Each step corresponds to a change in your Marginal Effective Tax Rate (METR). The reason for the change is given in the table below the chart. E: Each time the tax rate changes, the step is color coded, with the color corresponding to the reason for the change. |
An example of the results table is shown below. It summarizes the steps and why they occur.
The "Step Size" column shows how much your income needs to be reduced by to get to the next step.
The "Effective Tax Rate" column shows the Marginal Effective Tax Rate (METR) for each step. In this example, the Effective Tax Rate drops from 48.0% all the way down to 37.9% at the end of the potential contribution amount, which is a significant drop. Therefore, it is more optimal to end the contribution amount at $4,188, while the Effective Tax Rate is still 42.5%.
The "Event at End of Step" column gives the information on why the effective tax rate increases for decreases at the end of the step. It may decrease because the federal or provincial income tax rate has reduced with the lower net income, making any additional RRSP contribution less valuable. It may increase as a government benefit increases with lower income after the RRSP contribution.
| Step | Step Size | Cumulative RRSP Contribution | Effective Tax Rate | Cumulative Savings from RRSP Contribution | Event at end of Step |
|---|---|---|---|---|---|
| 1 | $2,931 | $2.931 | 48.0% | $1,407 | Federal Tax => Change in rate (-5.5%) |
| 2 | $1,257 | $4,188 | 42.5% | $1,941 | Provincial Tax => Change in rate (-1.8%) |
| 3 | $12,361 | $16,549 | 40.7% | $6,972 | Provincial Tax => Change in rate (-2.8%) |
| 4 | $3,451 | $20,000 | 37.9% | $8,280 | End of potential contribution amount |
The information on this site is for informational purposes only and is not intended to be a substitute for professional advice.
Please see the legal disclaimer for more information.