Marginal Effective Tax Rate (METR)
In Canada, there are many government benefits where the amount you receive depends on your income, or on your net family income. In most cases, as your income increases, the amount of benefit you receive is reduced (clawed back). Since you are essentially paying back the government a percentage of your income, the effect is very similar to an income tax. Your marginal effective tax rate (METR) is taking your federal and provincial income tax rates and combining them with the effective tax rate from government benefits, credits and tax deductions that are dependent on your income. Once the impact of these income tested items are included, a common effect is that people earning average income levels actually pay effective tax rate similar to or higher than the highest income earners. This is particularly true for people with children under the age of 18, as there are many federal and provincial benefits paid to the parents.
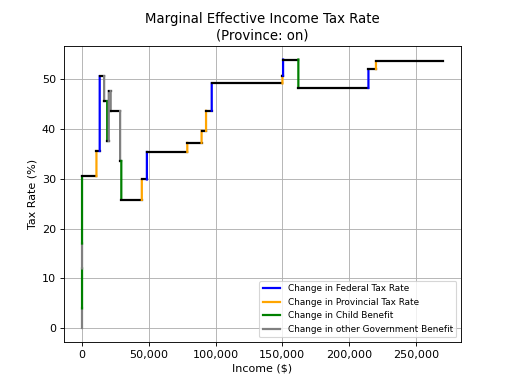
An example METR chart is below. The chart shows income on the x-axis and Marginal Effective Tax Rate (METR) on the y-axis. This example is for a married person living in Ontario with two kids and a spouse that does not earn any income.
Example Marginal Effective Tax Rate (METR) chart
If you chart your income tax rate vs income, it will just make jumps up as your income increases. When you look at the effects of the government benefits and credits that depend on your income, the chart now jumps up and down, meaning the effective tax rate can actually be higher at lower income levels, and this can significantly impact how you optimally make your RRSP decisions. In this example, the person is paying an effective tax rate of 60.1% for their income between $49,000 and $56,500, which is actually a higher marginal tax rate that somebody earning $250,000. The 60.1% effective tax rate is made up of federal income tax (20.5%), provincial income tax (9.1%), Canada Child Benefit clawback (13.5%), Ontario Child Benefit clawback (8.0%), GST Credit clawback (5.0%) and Ontario Sales Tax Credit clawback (4.0%). This means that 30.5% of the income in that range is being paid back in the form of reduction in benefits.
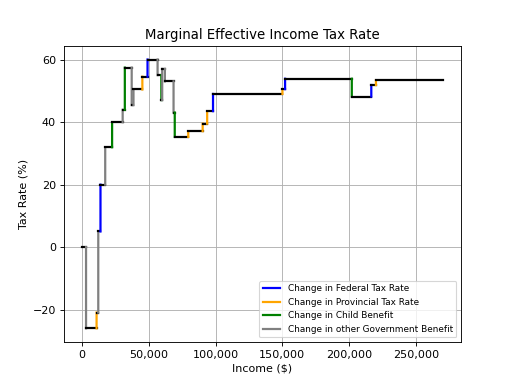
In the chart, there are cases where the METR is actually lower than 0%. A negative METR actually means that there is a government benefit that pays you more as your income increases, almost like you are getting a bonus on top of your income. In this example, it drops to -26% once the income reaches $3,000. This is due to the Canada Workers Benefit, where the amount your get paid increases for a period once your income reaches $3,000.
If you have a spouse, your spouse's income will impact how your own METR chart looks. This is because many income tested government benefits and credits are based on annual net family income (ANFI), which includes both your income and your spouse's income. In the chart above, for a person in Ontario with two kids and a spouse not earning any income, the Canada Child Benefit is fully clawed back (meaning no benefit is paid) once the income reaches approximately $200,000. This is represented by the green vertical line corresponding to the $200,000 income level. If the spouse now started earning an income of $40,000, the point at which the benefit is no longer received will shift down by $40,000 to approximately $160,000. This is shown in the updated chart below, where the vertical green line has shifted.
Example Marginal Effective Tax Rate (METR) chart including $40,000 spouse income